
Observing and Recording Solar Activity
By Andrew Wood
Introduction
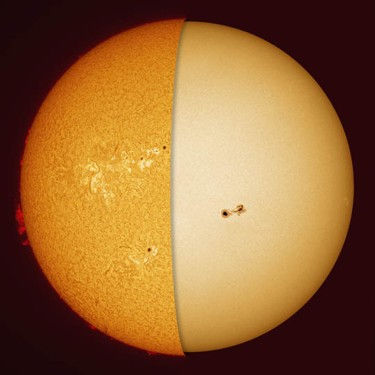
This article describes how to observe and record features of the solar disc in white light and hydrogen-alpha. The image Figure 1 shows the difference in appearance of the sun using these two methods.
Observing Solar Activity in White Light
What Sunspots Are
Sunspots are cooler, darker regions on the Sun’s visible surface. They form where strong magnetic fields restrict the upward flow of heat from below. Although the surrounding solar surface is about 5,800°C, sunspots are typically closer to 3,500°C, which makes them appear dark by contrast.
Sunspot observing is one of the simpler and more affordable activities available to amateur astronomers. A small telescope is adequate, provided it is fitted with a proper white-light solar filter that covers the full aperture at the front of the telescope. These filters are relatively inexpensive, but safe filtering is essential. [Projection onto a white surface is possible, but it concentrates the Sun’s heat and requires great care; for this reason, smaller-aperture telescopes are often better suited to sunspot work].
My Observing Program
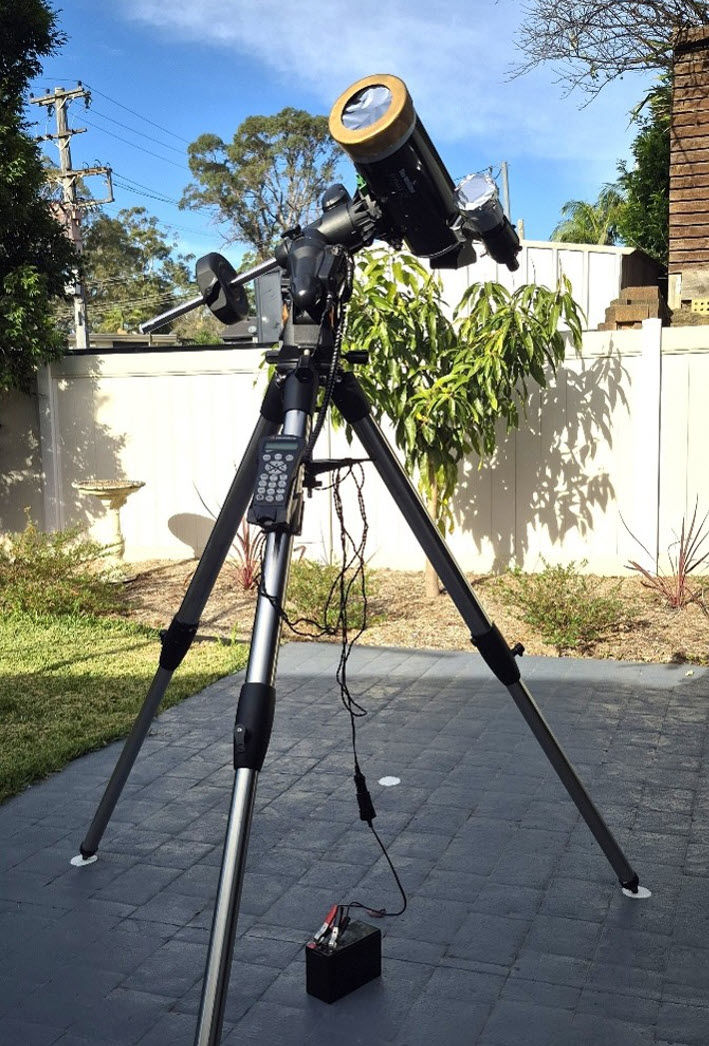
I have observed sunspots occasionally over the years, but since late April I have followed a more regular program. On clear mornings at home, I record sunspot activity with a 127mm Maksutov-Cassegrain telescope fitted with a front-mounted housing containing Baader Astro-Solar Safety Film. The set-up is shown in Figure 2. I use a driven system, which makes tracking the Sun easy, although a manually driven telescope is also very capable for solar observing.
The Solar Cycle and Sunspot features
Sunspot activity follows an approximately 11-year cycle, with the latest maximum occurring in 2024. Many sunspots are currently visible, but their number should gradually decline over the next few years as the Sun moves towards Solar Minimum. Sunspots may appear alone or in groups. Larger spots have a dark central umbra surrounded by a lighter, filament-like penumbra, and even the smallest visible sunspots are larger than Earth.
How I Record Observations
I begin each session by ensuring the solar filters are secured in place. I then centre the Sun in the telescope using the 50mm finder-scope attached to my telescope - again with its aperture covered by solar safety film. For interest, I count any visible sunspots seen through the finder.
Through the main telescope, I record the number of sunspot groups and the total number of individual sunspots. A single isolated sunspot counts as one group. These figures are then used to calculate the Relative Sunspot Number, a simple index of visible solar activity.
Calculating the Relative Sunspot Number
The Relative Sunspot Number (RSN), also known as the Wolf Number, is calculated from the number of sunspot groups and individual sunspots. The formula is:
R = k(10g + s)
In this formula:
R = Relative Sunspot Number (RSN)
g = number of sunspot groups
s = total number of individual sunspots
k = correction factor for the observer, telescope, and observing conditions
If k is left as 1, R is found by multiplying the number of groups by 10 and adding the total number of individual sunspots. The k-factor may later be adjusted by a professional body to account for differences in observers, instruments, and observing conditions.
Results so Far
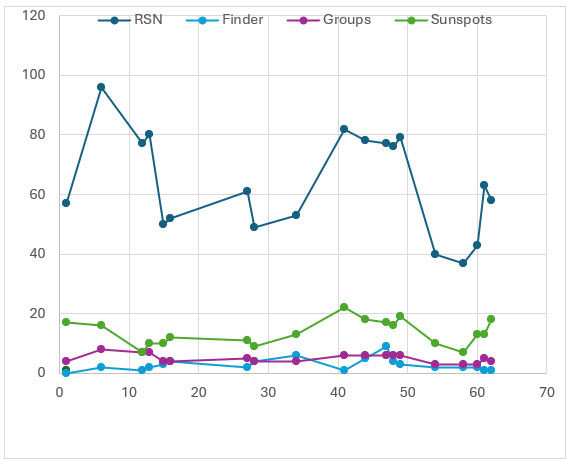
Figure 3 summarises my observations from late April to late June 2026. The horizontal axis shows the number of days since recording began, with Day 1 corresponding to 24 April. The last day I was able to observe was June 24. Observations were made on 19 days. The average number of sunspots was 14, the average number of groups was 5 and the average RSN was 58. [Also, an average of 3 sunspots that could be seen through the finder scope).
Contributing Observations to the BAA
This observing program became especially relevant at our June meeting, where Lyn Smith, director of the British Astronomical Association Solar Section, gave a presentation on the BAA’s collection of sunspot data. A recording of her presentation is on-line. Afterwards, I visited the BAA website, found the Solar Section page, and registered to submit observations. The site also provides a presentation explaining the submission process.
The BAA method differs slightly from the approach I had been using because it requires separate group and sunspot counts for the northern and southern hemispheres of the solar disc. After changing my daily records to match this format, I began adding my observations to the BAA Solar Database. [At the June meeting, I asked Lyn Smith about the k-factor in the Relative Sunspot Number formula. She advised ignoring it, as professional bodies may apply the correction later to account for factors such as atmospheric conditions and instrument type].
Recording Images
I took images of the sun – once again with solar filters covering the front lens – through cameras with telephoto lenses. When the images were uploaded to my computer, however, even with editing, the results were not very clear. I even built a projection apparatus to fix to the back of the telescope, took off the solar filter, and took photos of the projected image. If you do this, don’t place anything, especially any part of yourself, between the back of the telescope and the projected image.
Again, the result was less than satisfactory.
In the end, I decided to use black pencil on white paper and draw what I could see in the eyepiece. This turned out to be not only enjoyable, but the results were also much clearer than my photographic efforts.
Figure 4 depicts the drawings I made on June 22, 23 and 24 – the final three days of this observing period.
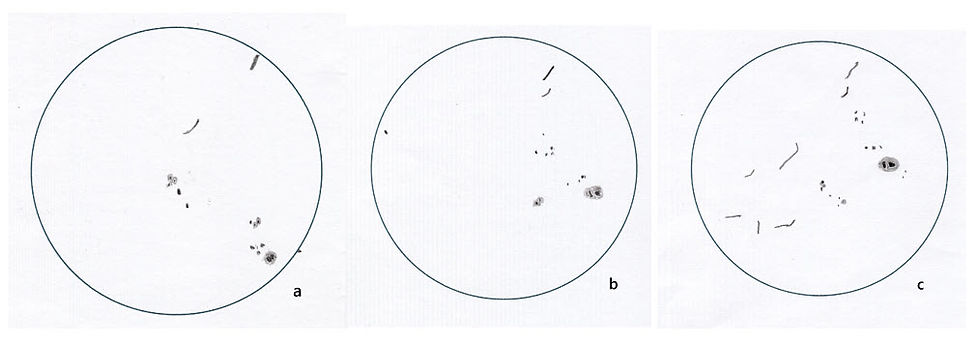
The drawings not only depict sunspots and their movement over the three days but also, I have drawn in long streaks. These are filaments, which I was able to see using a Hydrogen-Alpha Solar Telescope. More about this follows [Also see Dirks Goes’ post - The Solar Scout].
Observing Solar Activity in Hydrogen-alpha
White light filters to observe sunspots are an inexpensive amateur astronomer accessory. Delving deeper into the solar surface, however, requires viewing the Sun through Hydrogen-alpha. This is a more expensive option.
Hydrogen-alpha, usually written as H-alpha or Hα, is a very narrow wavelength of deep red light produced by hydrogen at 656.28 nanometres. Observing the Sun at this wavelength reveals the chromosphere, a layer above the bright photosphere not seen in ordinary white light. Instead of seeing only sunspots, H-alpha viewing shows the Sun as a far more active object.
A dedicated H-alpha solar telescope is built specifically for this purpose. It contains specialised filters that isolate the H-alpha line while rejecting the dangerous amount of heat and unwanted light from the Sun.
Through a small, dedicated H-alpha telescope, the Sun appears as a red-orange disc with features that are invisible in white light. Dark filaments may be seen stretching across the solar disc. These are clouds of cooler hydrogen gas suspended above the chromosphere by magnetic fields. When the same structures are seen at the edge of the Sun, they appear as prominences rising beyond the limb.
Prominences are among the most impressive sights in H-alpha. They look like small spikes, arches, loops, or flame-like projections along the edge of the Sun. Their appearance can change over minutes or hours.
On the face of the Sun, H-alpha observing can also show bright active regions around sunspots, known as plage. Around these areas the surface may appear mottled or textured, with fine dark and bright streaks shaped by magnetic activity. Under good conditions, the limb may also show a fringe of small grass-like jets called spicules.
Solar flares may also be visible in H-alpha, although they are less predictable. A flare appears as a sudden brightening in or near an active region, sometimes changing noticeably over a short time. For casual observing, however, filaments, prominences, plage, and the changing texture of the chromosphere are usually the most reliable features to look for.
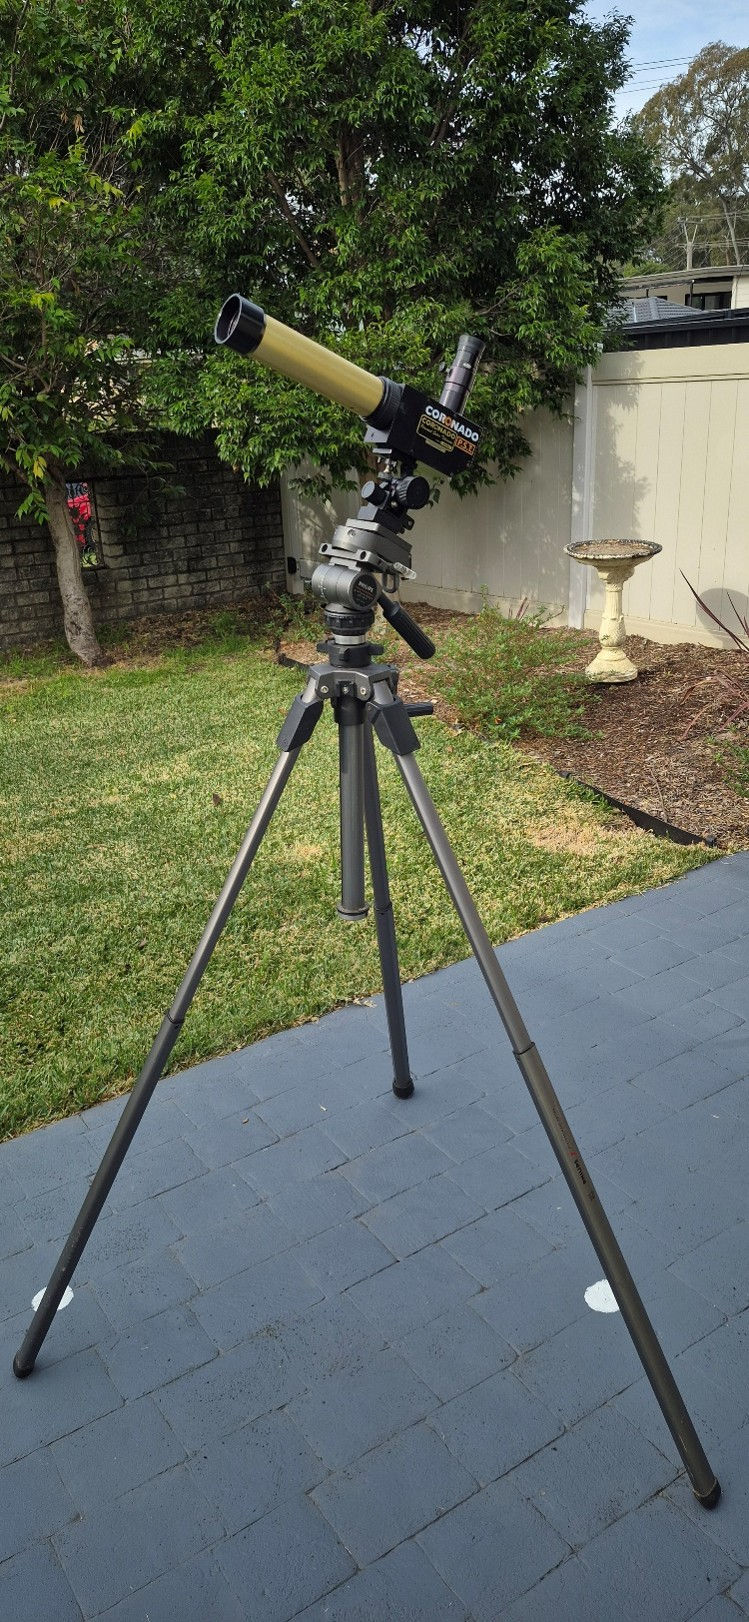
The BAA Solar Section has a separate area from white light observations in which H-alpha observations of Filaments, Plage and Prominences – and Flares, if you’re very lucky - can be recorded. I have access to a borrowed 40mm Coronado Personal Solar Telescope (PST). This is the most basic of solar telescopes on the market. Through it I have been able to see filaments as recorded in the drawings in Figure 4. I can also see plage, though these are beyond my drawing ability. Figure 4a depicts one small prominence at lower right.
I have also started to record my counts of filaments, prominences and plage on the BAA site. Figure 5 shows the set up I currently use.
Why it is Worth Doing
When undertaken safely, solar observing is an accessible and rewarding activity for amateur astronomers, especially white-light observing. Through our parent organisation, the BAA, Sydney City Skywatchers members can also contribute observations to a database that may be useful to professional astronomers.
It is also an engaging way to begin a sunny day.
Reading recent player reviews can help you understand what to expect before creating an account.